
Dylan Rock
Lexington Legends • OF
2022 8th Rd Pick (TOR) • Texas A&M 3x All-American
Historic Professional Milestones & Elite Pedigree
8-Game Home Run Record: Current Joint Professional Baseball Record Holder for consecutive games with a HR, joining Ken Griffey Jr., Don Mattingly and Don Lane.Elite 20/20 Club: Logged an ultra-rare 20+ HR and 20+ SB professional campaign during his 2025 Atlantic League season.
The Driveline Comeback Process
Following back-to-back hand surgeries that halted his affiliated trajectory, Dylan spent four months in strict physical shutdown before self-funding a total mechanical re-architecture at Driveline Baseball in Scottsdale, Arizona.
- Verified Max Exit Velocity: 111.0 MPH
- Documented Elite Swing Path & Front-Side Optimization
- 100% Structural Recovery and Biomechanical Health
Grand Slam vs TU
March 29, 2022 • Texas A&MSEC Tournament vs Alabama
May 27, 2022 • Texas A&MHR vs LSU (Back-to-Back)
March 20, 2022 • Texas A&M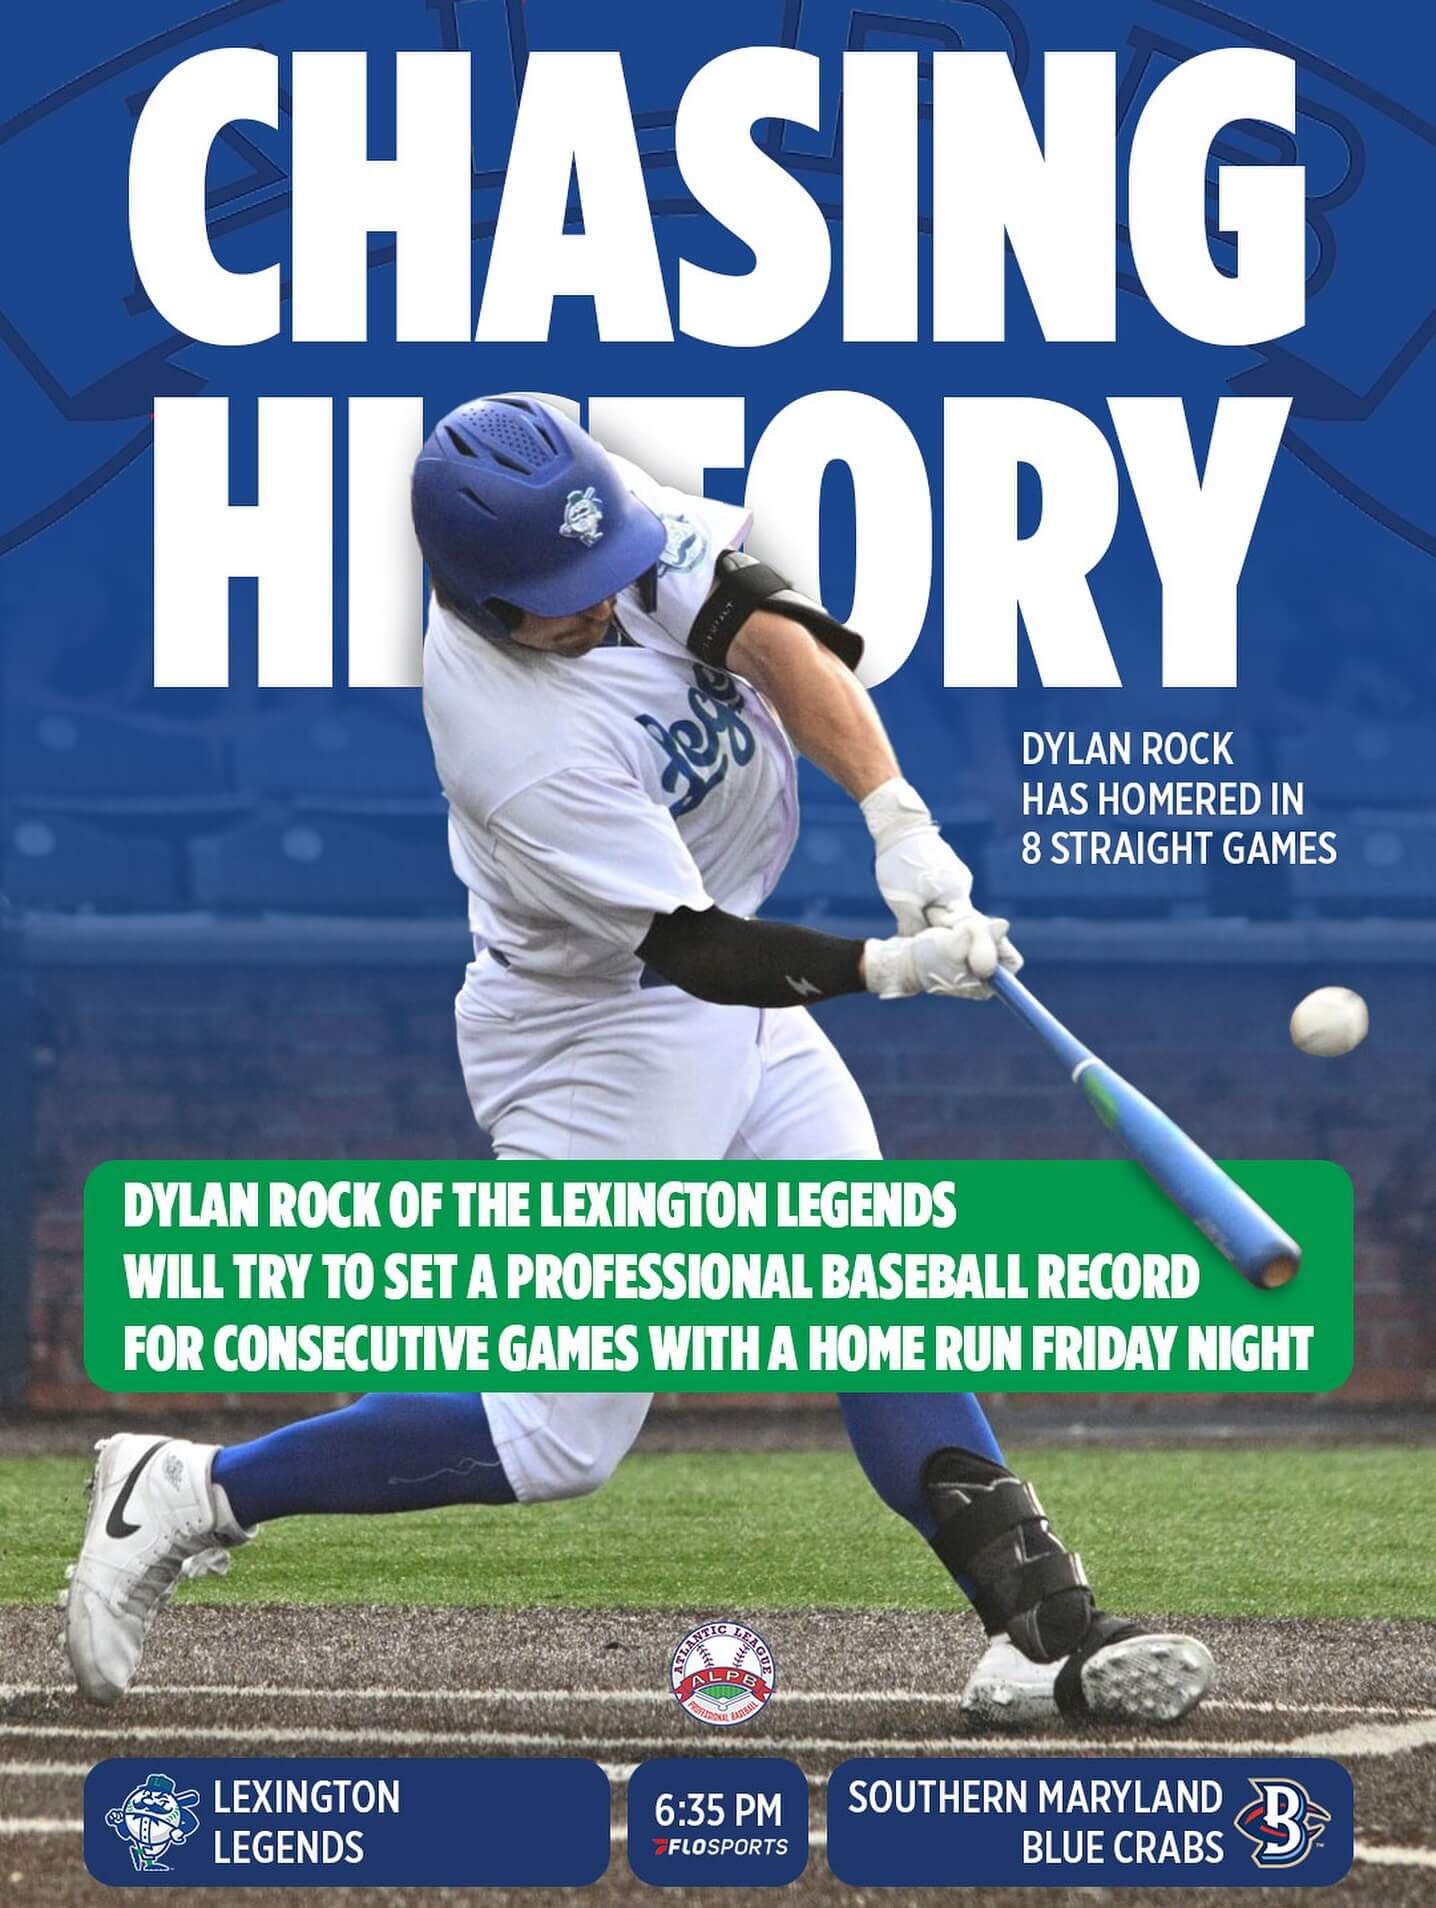
8-Game HR Streak Record
Professional Baseball MilestoneHR vs Ole Miss
May 19, 2022 • Texas A&MCollege World Series (MCWS)
June 22, 2022 • Texas A&MBaseball Reference 126-Game Pace Matrix
Aggregating live performance windows across 43 games played.Tag Translation: 95th% = outperforming 95% of league hitters.
| Timeline Track | Hits (H) | Home Runs (HR) | Stolen Bases (SB) | Runs (R) | Runs Batted In (RBI) |
|---|---|---|---|---|---|
| Season to Date (Now) |
48
76th%
|
7
76th%
|
11
95th%
|
28
62nd%
|
25
61st%
|
| 126-Game Projected Pace | 141 | 21 | 32 | 82 | 73 |
Season Trajectory (Season Bound)
Cumulative performance timeline
Micro Form Tracker (Season Bound)
10-Game moving window averages
Advanced Game Logs
| Date | Opponent | H/A | PA | AB | R | H | 2B | 3B | HR | SB | RBI | BB | SO |
|---|---|---|---|---|---|---|---|---|---|---|---|---|---|
| TOTALS | Cumulative Summary | - | 189 | 159 | 28 | 48 | 7 | 1 | 7 | 11 | 25 | 26 | 30 |
| 06/19/26 | High Point Rockers | AWAY | 5 | 5 | 1 | 1 | 0 | 0 | 0 | 0 | 0 | 0 | 0 |
| 06/18/26 | High Point Rockers | AWAY | 5 | 5 | 1 | 3 | 1 | 1 | 1 | 0 | 2 | 0 | 1 |
| 06/17/26 | High Point Rockers | AWAY | 4 | 4 | 0 | 1 | 0 | 0 | 0 | 0 | 0 | 0 | 0 |
| 06/16/26 | High Point Rockers | AWAY | 4 | 4 | 2 | 2 | 0 | 0 | 1 | 0 | 2 | 0 | 0 |
| 06/13/26 | Gastonia Ghost Peppers | HOME | 4 | 4 | 0 | 0 | 0 | 0 | 0 | 0 | 0 | 0 | 0 |
| 06/12/26 | Gastonia Ghost Peppers | HOME | 5 | 2 | 1 | 0 | 0 | 0 | 0 | 0 | 0 | 3 | 0 |
| 06/11/26 | Gastonia Ghost Peppers | HOME | 5 | 4 | 0 | 2 | 0 | 0 | 0 | 1 | 2 | 1 | 0 |
| 06/10/26 | Gastonia Ghost Peppers | HOME | 4 | 3 | 2 | 1 | 0 | 0 | 0 | 0 | 0 | 1 | 0 |
| 06/09/26 | Gastonia Ghost Peppers | HOME | 5 | 5 | 2 | 3 | 1 | 0 | 1 | 0 | 4 | 0 | 0 |
| 06/07/26 | Hagerstown Flying Boxcars | AWAY | 5 | 5 | 1 | 2 | 0 | 0 | 0 | 0 | 0 | 0 | 0 |
| 06/06/26 | Hagerstown Flying Boxcars | AWAY | 4 | 3 | 0 | 1 | 0 | 0 | 0 | 1 | 2 | 0 | 0 |
| 06/05/26 | Hagerstown Flying Boxcars | AWAY | 3 | 3 | 1 | 1 | 0 | 0 | 1 | 0 | 1 | 0 | 2 |
| 06/04/26 | Hagerstown Flying Boxcars | AWAY | 4 | 4 | 1 | 2 | 0 | 0 | 0 | 1 | 0 | 0 | 1 |
| 06/03/26 | Hagerstown Flying Boxcars | AWAY | 5 | 5 | 0 | 1 | 0 | 0 | 0 | 0 | 0 | 0 | 2 |
| 06/02/26 | Hagerstown Flying Boxcars | AWAY | 5 | 5 | 1 | 2 | 0 | 0 | 0 | 1 | 0 | 0 | 1 |
| 05/31/26 | High Point Rockers | HOME | 4 | 4 | 0 | 0 | 0 | 0 | 0 | 0 | 0 | 0 | 1 |
| 05/30/26 | High Point Rockers | HOME | 4 | 4 | 0 | 1 | 0 | 0 | 0 | 0 | 0 | 0 | 3 |
| 05/29/26 | High Point Rockers | HOME | 4 | 4 | 2 | 3 | 0 | 0 | 2 | 1 | 3 | 0 | 0 |
| 05/28/26 | Gastonia Ghost Peppers | HOME | 3 | 3 | 0 | 2 | 0 | 0 | 0 | 0 | 0 | 0 | 0 |
| 05/27/26 | Gastonia Ghost Peppers | HOME | 4 | 2 | 0 | 0 | 0 | 0 | 0 | 0 | 0 | 2 | 0 |
| 05/26/26 | Gastonia Ghost Peppers | HOME | 4 | 3 | 0 | 0 | 0 | 0 | 0 | 0 | 0 | 0 | 0 |
| 05/24/26 | Southern Maryland Blue Crabs | HOME | 4 | 3 | 1 | 1 | 0 | 0 | 0 | 1 | 0 | 1 | 1 |
| 05/23/26 | Southern Maryland Blue Crabs | HOME | 3 | 3 | 0 | 0 | 0 | 0 | 0 | 0 | 0 | 0 | 1 |
| 05/21/26 | Southern Maryland Blue Crabs | HOME | 5 | 5 | 0 | 1 | 0 | 0 | 0 | 0 | 0 | 0 | 3 |
| 05/13/26 | Charleston Dirty Birds | AWAY | 6 | 5 | 1 | 1 | 0 | 0 | 1 | 0 | 2 | 1 | 0 |
| 05/12/26 | Charleston Dirty Birds | AWAY | 4 | 3 | 1 | 0 | 0 | 0 | 0 | 0 | 0 | 1 | 0 |
| 05/10/26 | Lancaster Stormers | HOME | 4 | 3 | 0 | 1 | 1 | 0 | 0 | 0 | 1 | 1 | 1 |
| 05/09/26 | Lancaster Stormers | HOME | 5 | 5 | 1 | 2 | 1 | 0 | 0 | 1 | 2 | 0 | 1 |
| 05/08/26 | Lancaster Stormers | HOME | 4 | 4 | 0 | 1 | 0 | 0 | 0 | 0 | 0 | 0 | 0 |
| 05/07/26 | Lancaster Stormers | HOME | 4 | 2 | 0 | 1 | 0 | 0 | 0 | 1 | 0 | 2 | 1 |
| 05/05/26 | Lancaster Stormers | HOME | 4 | 2 | 1 | 1 | 0 | 0 | 0 | 1 | 0 | 2 | 0 |
| 05/03/26 | Long Island Ducks | AWAY | 5 | 2 | 1 | 1 | 1 | 0 | 0 | 0 | 1 | 2 | 0 |
| 05/02/26 | Long Island Ducks | AWAY | 4 | 4 | 1 | 2 | 1 | 0 | 0 | 0 | 0 | 0 | 0 |
| 05/01/26 | Long Island Ducks | AWAY | 5 | 4 | 1 | 1 | 1 | 0 | 0 | 0 | 0 | 1 | 0 |
| 04/30/26 | Long Island Ducks | AWAY | 5 | 5 | 0 | 1 | 0 | 0 | 0 | 0 | 0 | 0 | 0 |
| 04/29/26 | Long Island Ducks | AWAY | 4 | 4 | 1 | 1 | 0 | 0 | 0 | 0 | 0 | 0 | 0 |
| 04/28/26 | Long Island Ducks | AWAY | 4 | 3 | 0 | 1 | 0 | 0 | 0 | 0 | 0 | 1 | 2 |
| 04/26/26 | Charleston Dirty Birds | HOME | 4 | 4 | 1 | 1 | 0 | 0 | 0 | 0 | 0 | 0 | 2 |
| 04/25/26 | Charleston Dirty Birds | HOME | 4 | 2 | 0 | 0 | 0 | 0 | 0 | 1 | 0 | 2 | 1 |
| 04/24/26 | Charleston Dirty Birds | HOME | 6 | 4 | 2 | 2 | 0 | 0 | 0 | 0 | 1 | 2 | 0 |
| 04/23/26 | Charleston Dirty Birds | AWAY | 5 | 3 | 0 | 0 | 0 | 0 | 0 | 0 | 1 | 1 | 3 |
| 04/22/26 | Charleston Dirty Birds | AWAY | 4 | 4 | 0 | 0 | 0 | 0 | 0 | 0 | 0 | 0 | 1 |
| 04/21/26 | Charleston Dirty Birds | AWAY | 6 | 4 | 1 | 1 | 0 | 0 | 0 | 1 | 1 | 2 | 2 |
Baseball Savant Statcast Percentile Profile
Visualizing core discipline, power, and offensive efficiency standing across the player universe
Statcast Advanced Barrel & Approach Profile
Granular timeline trajectory mapping and swinging-strike execution summaries extracted from raw tracking streams
Strategic Approach & Directional Power Matrix
Count-based execution splits and directional contact mapping
| Contact Quality | Pull % | Center % | Oppo % |
|---|---|---|---|
| All Batted Balls | 37.2% | 32.2% | 30.6% |
| Base Hits | 39.6% | 29.2% | 31.3% |
| Extra-Base Hits | 40.0% | 40.0% | 20.0% |
| Home Runs | 57.1% | 28.6% | 14.3% |
Plate Discipline
Speed & Hustle
Hitting & Power Profile
Run Creation Engine
PA Efficiency %
Situational Execution
Savant 5-Tool Diamond
Tool mastery relative to benchmark parameters
Plate Appearance Footprint
Discipline breakdown per appearance
Team Impact Share
Dylan's volume share of total team hitting production
Park Advantage
| Split | AB | HR | AVG | OBP | SLG | OPS |
|---|---|---|---|---|---|---|
| Home | 75 | 3 | .307 | .435 | .467 | .901 |
| Away | 79 | 4 | .291 | .374 | .519 | .893 |
The Platoon Advantage
| Split | AB | HR | AVG | OBP | SLG | OPS |
|---|---|---|---|---|---|---|
| vs LHP | 34 | 1 | .265 | .359 | .382 | .741 |
| vs RHP | 120 | 6 | .308 | .417 | .525 | .942 |
The Clutch Factor
| Situation | AB | HR | RBI | AVG | OPS |
|---|---|---|---|---|---|
| RISP | 35 | 3 | 19 | .400 | 1.206 |
| Late & Close | 20 | 0 | 1 | .150 | .492 |
| Bases Loaded | 4 | 0 | 3 | .250 | .450 |
| Runners On | 65 | 5 | 23 | .292 | .925 |
| 2 Outs | 55 | 1 | 12 | .345 | .964 |
Count Discipline & Starts
| State | PA | BB | SO | AVG | OBP | OPS |
|---|---|---|---|---|---|---|
| Leadoff (Inning) | 45 | 6 | 8 | .237 | .356 | .724 |
| Ahead in Count | 66 | 26 | 8 | .300 | .576 | .976 |
| Even Count | 53 | 0 | 8 | .327 | .346 | .856 |
| Behind in Count | 65 | 0 | 14 | .277 | .277 | .815 |
| Bases Empty | 89 | 19 | 19 | .303 | .436 | .875 |